How has internet connectivity changed in the UK from 2015 to 2025?
Digital Divide Research · University of Warwick, 2025
Overview
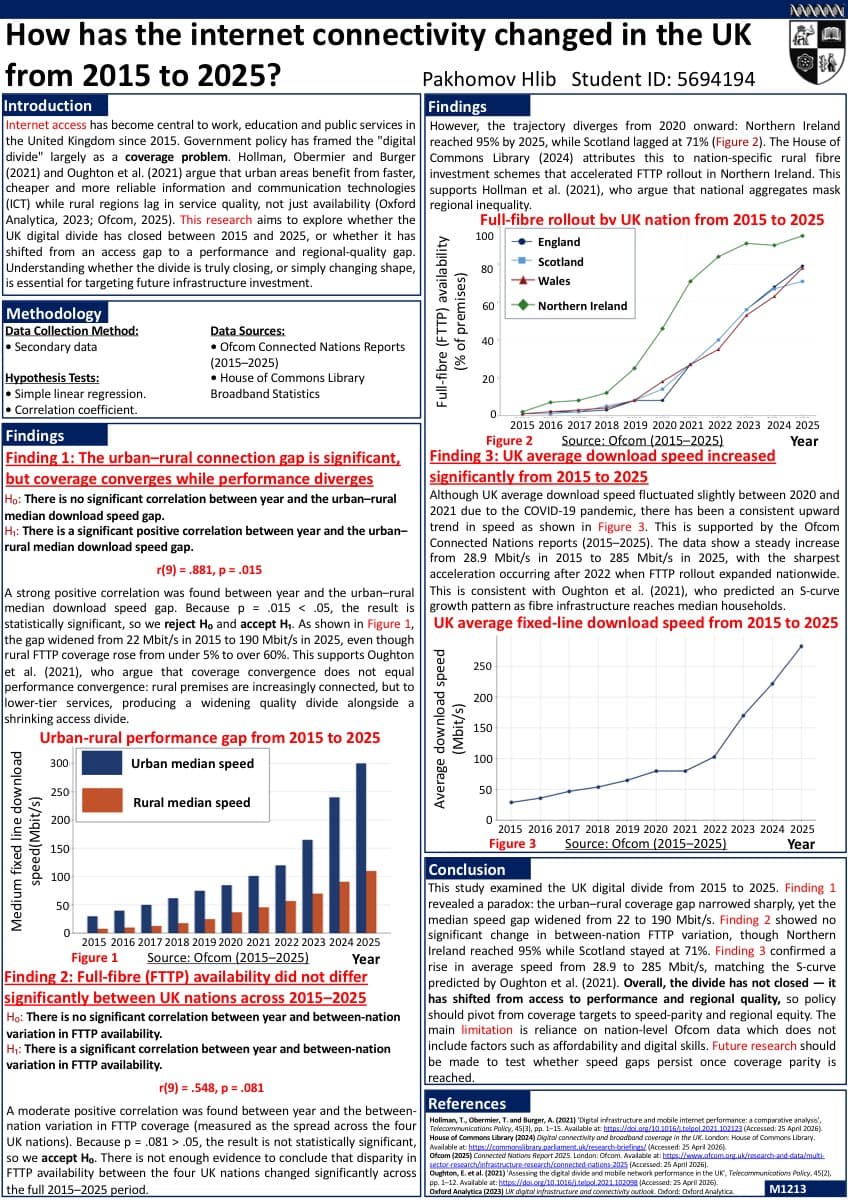
Internet access has become central to work, education, and public services in the UK since 2015. Government policy framed the “digital divide” as a coverage problem — build infrastructure, close the gap. This research asks a harder question: has the divide actually closed, or has it simply changed shape?
Using public datasets from Ofcom Connected Nations Reports (2015–2025) and the House of Commons Library, the analysis uncovered a counterintuitive paradox: as rural coverage improved dramatically, the performance gap widened to its largest recorded level.
Key Findings
Strong significant correlation between year and the urban–rural median download speed gap. The gap widened from 22 Mbit/s in 2015 to 190 Mbit/s in 2025 — even as rural FTTP coverage rose from under 5% to over 60%.
No significant change in between-nation variation overall, but trajectories diverged sharply from 2020. Northern Ireland reached 95% FTTP by 2025; Scotland lagged at 71%.
Consistent S-curve growth across the decade. A brief dip in 2020–21 during COVID-19 was followed by sharp acceleration after 2022 as large-scale FTTP deployment expanded.
Research Poster
Full visual summary — methodology, charts, and key findings condensed onto one page. Click to download the PDF.
Learning Outcomes
Working with real-world data
Cleaned and reconciled Ofcom datasets spanning a decade — handling inconsistent column names, missing years, and methodology changes between report editions.
Statistical reasoning under uncertainty
Applied Pearson correlation and hypothesis testing to draw defensible conclusions. Learned to distinguish statistical significance from practical significance when interpreting p-values close to the threshold.
Visualisation as an argument
Designed charts in Matplotlib to make the speed-gap paradox immediately visible. Each visual choice — axis scale, colour, annotation — was made to support the central claim rather than just display data.
Nuance in policy analysis
Realised that surface-level metrics (coverage percentages) can mask underlying inequality. Framing the conclusion around speed parity rather than access parity required moving beyond the data to interpret what it actually meant.